
What happens when your blood sugar tests come back normal, but you still struggle with unexplained weight gain, constant fatigue, and stubborn food cravings? If this sounds familiar, you might be among millions who are missing a crucial diagnosis.
The truth is, traditional blood tests often tell only half the story. Your blood sugar could be perfectly normal while insulin resistance – a serious metabolic condition – silently develops. Today at IFitCenter, we’re diving deep into the real story behind insulin resistance testing to help you understand what to actually look for.
Whether you’re just starting to investigate your symptoms or have been searching for answers for years, this comprehensive guide will walk you through exactly which tests matter, how to interpret your results, and what to discuss with your healthcare provider.
How to Test for Insulin Resistance: Blood Test
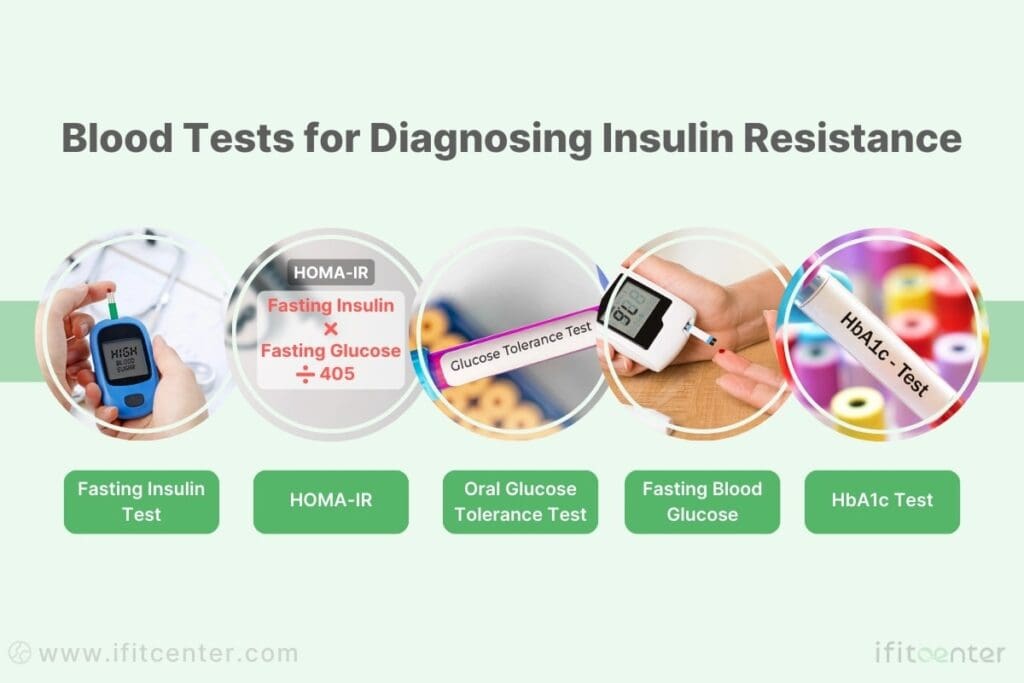
Understanding which blood tests can detect insulin resistance is crucial for early diagnosis. Think of these tests as different windows into your metabolic health – each one provides a unique view of how well your body processes energy.
Fasting Insulin Test
The most direct way to assess insulin resistance is, surprisingly, rarely performed: measuring your fasting insulin levels. Imagine your insulin like a key that unlocks cells to let in glucose. When you have insulin resistance, your body needs to make more keys (insulin) because the locks (cells) aren’t working properly. This test measures how many “keys” your body is producing while fasting.
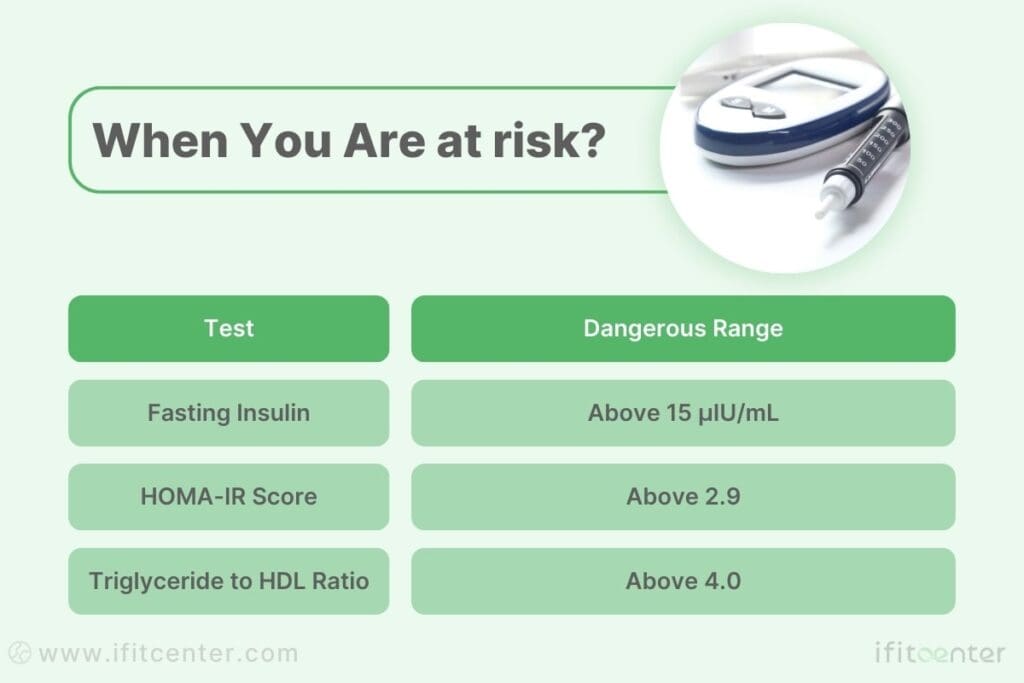
Optimal fasting insulin levels should be below 10 μIU/mL. Levels above 15 μIU/mL often indicate insulin resistance, even when blood sugar levels appear normal.
Oral Glucose Tolerance Test (OGTT)
This test shows how efficiently your body handles sugar over time. It’s like a stress test for your metabolism – you drink a specific amount of glucose solution, then blood samples are taken at intervals to measure both glucose and insulin responses.
HOMA-IR Calculation
HOMA-IR combines your fasting glucose and insulin levels into a single score that indicates insulin resistance. A score above 1.9 suggests early insulin resistance, while values above 2.9 indicate significant insulin resistance.
Fasting Blood Glucose
While this common test alone isn’t enough to diagnose insulin resistance, it provides important baseline information. Normal fasting glucose levels can exist even with significant insulin resistance, which is why additional testing is crucial.
HbA1c Test
This test provides a three-month average of your blood sugar levels. Think of it as a long-term report card for your glucose management. While useful, remember that like fasting glucose, HbA1c can appear normal even with significant insulin resistance.
“By the time blood glucose or HbA1c becomes abnormal, you’ve already had insulin resistance for some time – possibly years. That’s why looking at insulin levels directly is so important.”
Dr. Benjamin Bikman, “Why We Get Sick”
Understanding Your Insulin Resistance Test Results
Getting your test results is one thing – knowing what they mean for your health is another. Let’s decode these numbers and understand what they’re telling you about your metabolic health.
“Many patients are surprised to learn that their triglyceride to HDL ratio is often more revealing than fasting glucose. A ratio above 3.5 can indicate insulin resistance even when blood sugar appears perfectly normal. This simple calculation from your standard lipid panel can give us early insights into metabolic health long before other markers show problems.”
Dr. Babak Jamalian, Family Physician.
On the IFitCenter blog, we have published a free content bank about insulin resistance that can have a significant impact for you in controlling and preventing this metabolic disease. For access, simply use the links below:
- what is insulin resistance?
- signs of insulin resistance
- worst foods for insulin resistance
- how to reverse insulin resistance
Normal Ranges: What Do Your Numbers Mean?
Here are the key numbers to understand when reviewing your test results:
- Fasting Insulin:
- Optimal: Below 10 μIU/mL
- Early insulin resistance: 10-15 μIU/mL
- Significant insulin resistance: Above 15 μIU/mL
- HOMA-IR Score:
- Optimal: Below 1.9
- Early insulin resistance: 1.9-2.9
- Significant insulin resistance: Above 2.9
- Triglyceride to HDL Ratio:
- Optimal: Below 2.0
- Increased risk: 2.0-4.0
- High risk: Above 4.0
The Complete Picture: Looking at Multiple Test Results
No single test tells the whole story. Think of each test result as a piece of a puzzle – they work together to create a complete picture of your metabolic health. For example, you might have normal fasting glucose but elevated insulin levels, indicating your body is working overtime to maintain normal blood sugar.
“Looking at insulin resistance is like watching a movie, not taking a snapshot. We need multiple markers over time to understand the full story.”
Dr. Robert Lustig
Warning Signs: When to Seek Additional Testing
Consider further testing if you notice:
- Normal blood sugar but fasting insulin above 10 μIU/mL
- A significant change in your triglyceride to HDL ratio
- Persistent symptoms despite “normal” basic test results
- Family history of type 2 diabetes with borderline results
Taking Action Based on Your Results
Understanding your test results empowers you to take control of your metabolic health. Even slightly elevated numbers can be an opportunity to make positive changes before more serious problems develop.
Advanced Tests for Insulin Resistance
While basic blood sugar tests are important, advanced diagnostic methods can reveal insulin resistance long before traditional tests show problems. These sophisticated tests provide a deeper look into your metabolic health.
“When interpreting C-peptide levels, we often see a fascinating pattern: elevated levels in early insulin resistance, followed by a gradual decline as the condition progresses. This shift tells us not just about current insulin production, but also about how long the pancreas has been struggling to maintain normal blood sugar – information we can’t get from standard glucose tests alone.”
Dr. Babak Jamalian, Family Physician.
Triglyceride to HDL Ratio: The Simple but Powerful Marker
One of the most accessible yet powerful indicators of insulin resistance is the ratio between your triglycerides and HDL cholesterol. Think of this ratio as a window into how well your body processes and stores fat. When insulin resistance develops, this ratio typically increases.
- Optimal ratio: below 2.0
- Borderline: 2.0 to 4.0
- High risk: above 4.0
C-peptide Test: Measuring Your Body’s Insulin Production
C-peptide is produced in equal amounts to insulin, making it an excellent marker for understanding your body’s insulin production. Unlike insulin levels that can fluctuate rapidly, C-peptide provides a more stable picture of your insulin production over time.
Advanced Insulin Sensitivity Tests
These specialized tests measure how effectively your body responds to insulin. While more complex than standard tests, they can provide crucial insights, especially when other results are inconclusive:
- Insulin Suppression Test
- Insulin Clamp Studies
- Frequently Sampled IV Glucose Tolerance Test
Pro-insulin Levels: A Window into Pancreatic Function
Pro-insulin is the precursor to insulin. When your body is struggling to keep up with insulin demand, pro-insulin levels often rise. This can indicate stress on your insulin-producing cells long before other tests show problems.
“Advanced testing methods can reveal metabolic problems years before traditional tests show any issues. This early detection window is crucial for preventing more serious health complications.”
While these tests may not all be necessary for everyone, they provide valuable tools for understanding complex or unclear cases of insulin resistance. Your healthcare provider can help determine which advanced tests might be most beneficial for your situation.
Body Composition Analysis: A Key Tool in Diagnosing Insulin Resistance
Your body composition tells a more detailed story about metabolic health than weight alone. Understanding how your body stores and distributes fat can provide crucial insights into insulin resistance, often before blood tests show any abnormalities.
Body Fat Percentage: Beyond the Scale
While total body fat matters, the real story lies in where that fat is stored. Research shows that individuals with the same BMI can have vastly different metabolic health profiles based on their body fat distribution. For women, a body fat percentage above 32% may indicate increased risk of insulin resistance, while for men, the threshold is typically around 25%.
Waist Circumference: The Simple Yet Powerful Indicator
Your waist circumference can be one of the most reliable indicators of insulin resistance risk. The reason? It directly reflects the amount of visceral fat around your organs. For optimal metabolic health, aim for:
- Women: Less than 35 inches (88 cm)
- Men: Less than 40 inches (102 cm)
Muscle Mass: Your Metabolic Engine
Muscle tissue plays a crucial role in glucose metabolism. In fact, your muscles are responsible for up to 80% of insulin-mediated glucose disposal. Higher muscle mass typically correlates with better insulin sensitivity, which is why maintaining muscle mass is crucial for metabolic health.
To access the second part of the insulin resistance content, I invite you to use the links below:
- child insulin resistance symptoms
- best supplements for insulin resistance
- weight gain insulin resistance
- diabetes and insulin resistance
Visceral Fat: The Hidden Risk Factor
Visceral fat, the type that surrounds your organs, is particularly concerning for insulin resistance. Unlike subcutaneous fat that you can pinch, visceral fat actively produces hormones and inflammatory substances that can directly impact insulin sensitivity.
“The location of fat matters more than the total amount. Visceral fat around organs is metabolically more active and potentially more harmful than subcutaneous fat under the skin.”
Common Challenges in Diagnosing Insulin Resistance
Getting an accurate insulin resistance diagnosis isn’t always straightforward. Understanding these common challenges can help you advocate for more thorough testing when needed.
Why Insulin Resistance Often Goes Undiagnosed
Several factors can lead to missed or delayed diagnoses:
- Over-reliance on basic blood sugar tests
- Not testing insulin levels directly
- Dismissing symptoms when basic tests appear normal
- Focusing only on weight rather than body composition
Factors That Can Affect Your Test Results
Many everyday factors can influence your test results, potentially leading to inaccurate readings:
- Recent exercise (can improve insulin sensitivity temporarily)
- Stress levels (cortisol can affect insulin function)
- Sleep quality (even one poor night’s sleep can impact results)
- Medications (certain drugs can alter insulin sensitivity)
- Time of day (hormonal fluctuations affect results)
When to Get Retested
Consider retesting under these circumstances:
- Symptoms persist despite normal initial results
- Significant lifestyle changes in the past 3-6 months
- Family history of diabetes with borderline results
- Changes in medication that might affect metabolism
- Unexplained weight changes
The Power of Comprehensive Testing
Looking at multiple markers together provides a more accurate picture than any single test. Think of it like putting together a puzzle – each test reveals a different piece of your metabolic health story.
“A single normal blood sugar reading tells us very little about metabolic health. It’s like trying to understand the plot of a movie by looking at a single frame.”
For reliable diagnosis, consider combining:
- Multiple blood markers (insulin, glucose, lipids)
- Body composition analysis
- Clinical symptoms assessment
- Family history evaluation
Important Note: If your healthcare provider isn’t considering these factors or dismisses your concerns despite persistent symptoms, consider seeking a second opinion from a provider experienced in metabolic health.
What to Do After Your Insulin Resistance Tests
Getting your test results is just the beginning. The real value comes from understanding what these results mean for your health and taking appropriate action. Let’s explore the essential steps to take after testing.
Making Sense of Your Test Results
Your test results tell a story about your metabolic health. Key points to consider:
- Look at trends rather than single numbers
- Consider how different markers relate to each other
- Compare results to your previous tests if available
- Document any symptoms you’ve experienced
Partnering with Healthcare Providers
A knowledgeable healthcare provider can be invaluable in interpreting your results and creating a treatment plan. When meeting with your provider:
- Bring copies of all test results
- Share your complete health history
- Discuss any lifestyle changes you’ve already made
- Ask about monitoring frequency
- Request clear explanations of recommendations
Planning Your Follow-up Testing
Regular monitoring helps track progress and catch any changes early. Typical follow-up schedules include:
- Insulin and glucose tests every 3-6 months
- Body composition analysis quarterly
- Comprehensive metabolic panels annually
- More frequent testing if implementing lifestyle changes
Creating Your Action Plan
An effective action plan should be personalized to your specific situation and test results. Key components often include:
- Specific lifestyle modifications based on test results
- Regular testing schedule
- Clear, measurable goals
- Progress tracking methods
- Support system identification
“The key to managing insulin resistance isn’t just knowing your numbers – it’s understanding what to do with that knowledge and taking consistent action.”
Testing is Just the First Step
Getting tested for insulin resistance gives you valuable insights into your metabolic health—but the next crucial step is correcting the underlying issue. Losing excess weight has been scientifically proven to improve insulin sensitivity, reduce metabolic risk factors, and even reverse early-stage insulin resistance.
At IFitCenter, we provide:
✔ Comprehensive testing to determine your insulin resistance level
✔ Expert-guided weight loss strategies customized to your metabolism
✔ Ongoing support from medical professionals to ensure long-term success
Don’t stop at testing—start transforming your health today. Work with our expert team to create a structured weight loss plan tailored to your needs.
Taking Action: How to Diagnose Insulin Resistance
Let’s recap the essential points about insulin resistance testing and outline clear steps you can take to protect your metabolic health.
Key Testing Insights
- Don’t rely solely on blood sugar tests – insulin levels matter more for early detection
- Consider multiple markers together for a complete picture
- Body composition, especially visceral fat, provides crucial insights
- Regular monitoring is key to catching changes early
- Test results can vary based on lifestyle factors
When to Seek Professional Help
Consider consulting a healthcare provider if you experience:
- Unexplained weight changes despite normal eating habits
- Persistent fatigue or energy crashes after meals
- Dark patches of skin around your neck or in body folds
- Family history of diabetes with concerning symptoms
- Normal blood sugar but other metabolic symptoms
Immediate Steps You Can Take
- ✓ Review your most recent blood test results
- ✓ Measure and record your waist circumference
- ✓ Document any symptoms you’re experiencing
- ✓ Schedule comprehensive metabolic testing
- ✓ Start tracking your energy levels after meals
Additional Resources
To deepen your understanding of insulin resistance and metabolic health:
- Professional medical associations’ guidelines on metabolic health
- Peer-reviewed research on insulin resistance testing
- Educational materials about metabolic health monitoring
- Support groups for metabolic health management
“Understanding your metabolic health through proper testing isn’t just about preventing problems – it’s about optimizing your overall health and vitality.”
Remember: Early detection through proper testing gives you the best chance of preventing or reversing insulin resistance. Don’t wait for obvious symptoms to take action.
To access other content on the IFitCenter’s blog, you can use the following links:
References for How to Check Insulin Resistance
- Gastaldelli A. Measuring and estimating insulin resistance in clinical and research settings. Obesity. 2022;30(S1):S72-S83. DOI: 10.1002/oby.23503.
- Triantafyllou GA, Paschou SA, Mantzoros CS. Biomarkers of insulin sensitivity/resistance. Postgraduate Medical Journal. 2024;100(1192):623-635. DOI: 10.1177/03000605241285550.
- Guerrero-Romero F, Simental-Mendía LE, González-Ortiz M, et al. Diagnostic Accuracy of the Triglyceride and Glucose Index for Insulin Resistance: A Systematic Review. International Journal of Endocrinology. 2020:4678526. DOI: 10.1155/2020/4678526.
- Varvel SA, Voros S, Thiselton DL, et al. Comprehensive Biomarker Testing of Glycemia, Insulin Resistance, and Beta Cell Function Has Greater Sensitivity to Detect Diabetes Risk Than Fasting Glucose and HbA1c and Is Associated with Improved Glycemic Control in Clinical Practice. Journal of Cardiovascular Translational Research. 2014;7(6):597-606. DOI: 10.1007/s12265-014-9577-1.


