
Have you ever wondered why the same blood pressure reading might be concerning for a 30-year-old but acceptable for someone in their 70s? Or why your doctor suddenly classified your blood pressure as “elevated” when nothing changed except the guidelines? Perhaps you’re confused about which number matters more—the top one or the bottom one? If you’ve ever sat in a doctor’s office puzzled by the significance of your blood pressure reading, you’re not alone.
Blood pressure charts serve as critical roadmaps for understanding cardiovascular health, yet they remain enigmatic for many. Today at IFitCenter, we’re demystifying these vital numbers. By breaking down what blood pressure charts really mean—for different ages, genders, and health conditions—we’ll empower you to take control of your health with confidence. No more confusion, no more uncertainty—just clear, actionable knowledge about your blood pressure readings and what they mean for your overall wellbeing.
What Do Blood Pressure Numbers Mean?
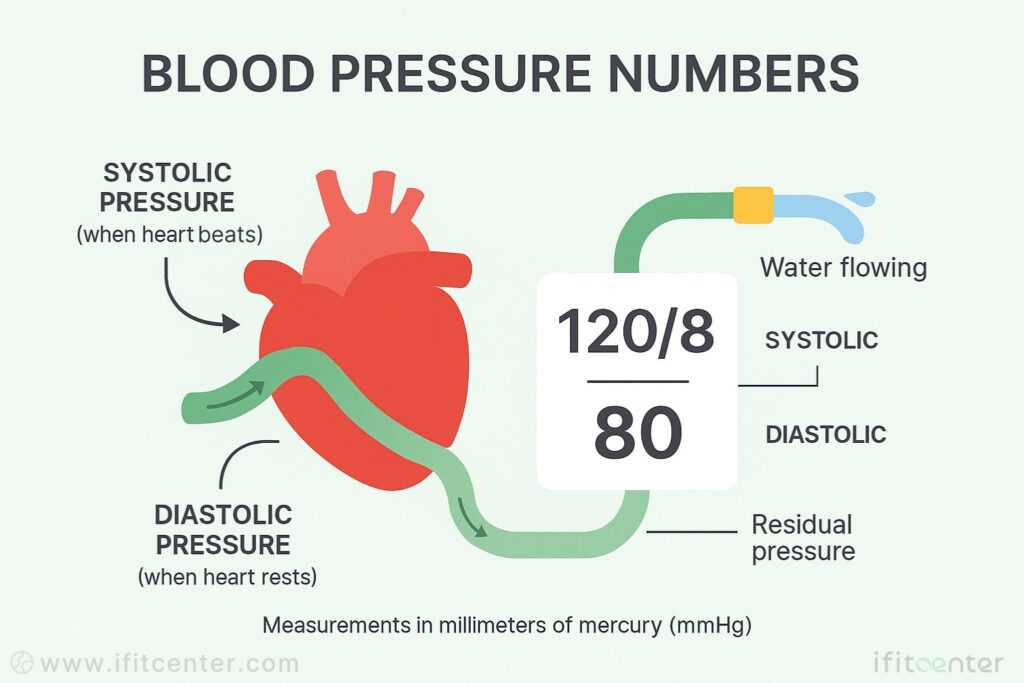
Every blood pressure reading shows two numbers, like 120/80 mmHg. These numbers represent the pressure in your arteries during different phases of your heartbeat.
Understanding Systolic and Diastolic Pressure
The top number (systolic pressure) measures the force when your heart beats. Think of it like water pressure when you first turn on a garden hose – there’s a surge as water pushes through.
The bottom number (diastolic pressure) shows the force when your heart rests between beats. This is like the pressure that remains in the hose even when water isn’t flowing at full force.
Both are measured in millimeters of mercury (mmHg), a standard unit for blood pressure. When your doctor says “120 over 80,” they’re referring to systolic over diastolic pressure.
Why Both Numbers Matter
High systolic pressure means your heart works too hard to pump blood. This extra force can damage arteries over time, increasing risks of heart disease and stroke.
Elevated diastolic pressure indicates your arteries remain under too much pressure even between heartbeats. This prevents proper relaxation of blood vessels and can lead to long-term damage.
Which Number Is More Important?
Medical understanding has evolved over time. Research now shows that systolic pressure (the top number) is generally a stronger predictor of cardiovascular problems, especially in adults over 50.
The American Heart Association identifies elevated systolic pressure as the primary concern for most adults. This is particularly true for older adults who may develop isolated systolic hypertension.
However, significant changes in either number warrant attention. Both provide important information about your cardiovascular health.
Normal Fluctuations
A single elevated reading doesn’t necessarily indicate chronic high blood pressure. Blood pressure naturally changes throughout the day due to activity, stress, food, and even time of day.
For accurate assessment, multiple readings over time are necessary. Keeping a log of measurements taken at the same time each day can provide valuable insights about your cardiovascular health.
On the IFitCenter blog, we have prepared a free information database about various diseases, including high blood pressure, for you, our dear readers. By reviewing these resources, you will gain valuable information for controlling and preventing these conditions. To access the first part of the information, you can use the links below:
- What Is Normal Blood Pressure?
- What Causes High Blood Pressure?
- How to Measure Blood Pressure
- High Blood Pressure symptoms
- How to Lower Blood Pressure Immediately
- Which oil is best for heart and cholesterol
Blood Pressure Chart: Understanding the Categories
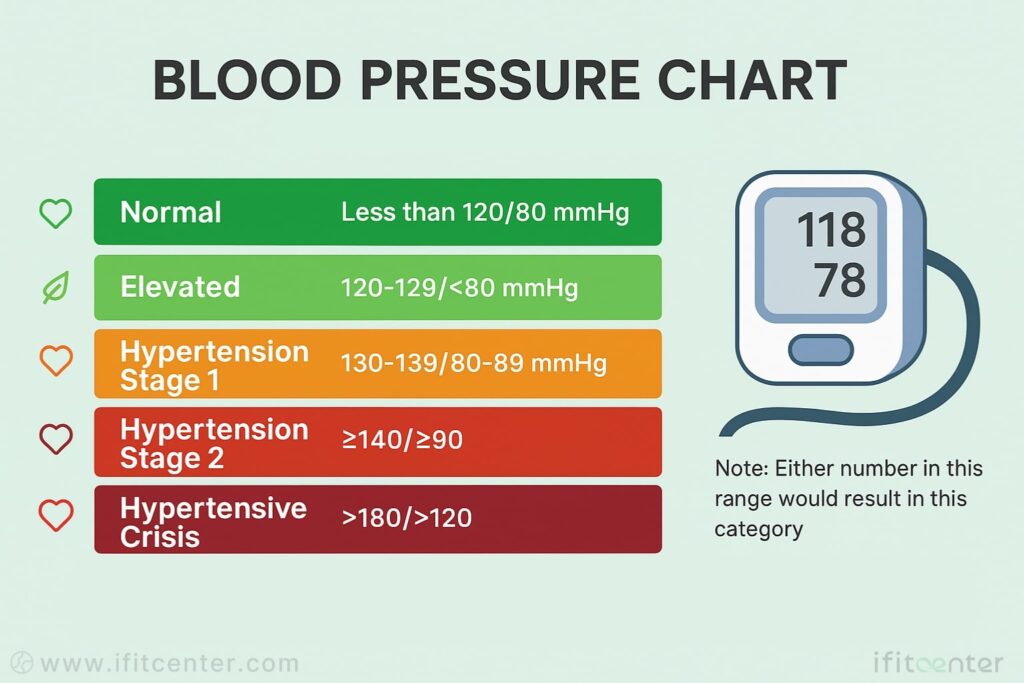
Blood pressure readings fall into five main categories according to the American Heart Association and American College of Cardiology guidelines. Understanding which category your readings belong to helps you assess your cardiovascular health and determine when to take action.
Blood Pressure Categories Explained
The chart below explains what each blood pressure category means for your health:
| Category | Systolic (mmHg) | Diastolic (mmHg) | What It Means |
|---|---|---|---|
| Normal | Less than 120 | Less than 80 | Your blood pressure is considered optimal. Maintain healthy lifestyle habits. |
| Elevated | 120-129 | Less than 80 | This is the yellow flag zone. Without intervention, elevated blood pressure often progresses to hypertension. |
| Hypertension Stage 1 | 130-139 | 80-89 | Your doctor may suggest lifestyle changes and possibly medication based on your overall cardiovascular risk. |
| Hypertension Stage 2 | 140 or higher | 90 or higher | This category usually requires medication along with lifestyle modifications to reduce health risks. |
| Hypertensive Crisis | Higher than 180 | Higher than 120 | This is an emergency requiring immediate medical attention, especially if accompanied by symptoms. |
It’s important to note that either number being in a higher category puts your overall reading in that category. For example, if your systolic pressure is 135 (Stage 1) but your diastolic is normal at 75, your blood pressure would still be classified as Stage 1 hypertension.
Special Types of High Blood Pressure
Sometimes only one number may be elevated. When only the systolic pressure is high (above 130 mmHg) while diastolic remains normal, it’s called isolated systolic hypertension. This becomes more common as we age and arteries stiffen.
Conversely, when only the diastolic number is elevated while systolic pressure remains normal, it’s called isolated diastolic hypertension. This is less common but still requires monitoring.
Tracking Your Blood Pressure Category
Regular monitoring helps track whether your blood pressure is stable, improving, or worsening over time. A single reading isn’t enough to diagnose hypertension—healthcare providers typically take measurements on multiple occasions before making a diagnosis.
If you’re tracking your blood pressure at home, record readings at the same time each day under similar conditions. This consistency helps identify meaningful patterns that can inform health decisions.
“Many patients are surprised to learn that a reading of 135/85 would now be classified as Stage 1 hypertension, whereas just a few years ago it would have been considered ‘pre-hypertension.’ This shift in guidelines isn’t about labeling more people as hypertensive—it’s about identifying cardiovascular risk earlier. Research shows that the risk of heart disease begins to increase at levels we once considered borderline. Understanding where you fall on today’s blood pressure chart allows for earlier intervention, often through lifestyle changes alone.”
Dr. Babak Jamalian, Family Physician
Interpret Your Readings with a Clinical Expert at IFitCenter
Knowing your blood pressure numbers is only half the equation—understanding what they mean for your overall health is where real transformation begins. At IFitCenter, we help you go beyond the chart with:
✔ In-depth evaluation of your readings in context
✔ Metabolic screening to uncover hidden drivers like insulin resistance
✔ Tailored weight management strategies to improve long-term control
Get the clarity and support you need to take meaningful action.
Blood Pressure Chart by Age
Blood pressure typically changes throughout our lifetime. While the ideal blood pressure remains below 120/80 mmHg for adults of all ages, average readings tend to increase as we grow older.
To access the second section of blood pressure articles, I invite you to use the links below:
- dash diet for hypertension
- complications of hypertension
- Best foods for hypertension
- Foods to Avoid with hypertension
- is green tea good for hypertension?
- is coffee good for hypertension?
- is headache a sign of hypertension?
- Hypertension and obesity
- How long to fast to reduce blood pressure
Age-Based Blood Pressure Averages
Research shows distinct blood pressure patterns across different age groups:
| Age Group | Average BP (Male) | Average BP (Female) |
|---|---|---|
| Children (3-5 years) | 95-110/56-70 | 95-110/56-70 |
| Children (6-13 years) | 97-112/57-71 | 97-112/57-71 |
| Adolescents (14-17) | 112-128/66-80 | 112-128/66-80 |
| Adults (18-39) | 119/70 | 110/68 |
| Adults (40-59) | 124/77 | 122/74 |
| Adults (60+) | 133/69 | 139/68 |
It’s important to understand that these are averages, not ideals. The target blood pressure remains below 120/80 mmHg regardless of age.
Why Blood Pressure Increases With Age
Blood pressure naturally tends to rise as we age due to several physiological changes:
- Arterial stiffening: Our blood vessels become less elastic over time
- Plaque buildup: Arteries narrow as fatty deposits accumulate
- Changes in hormone levels that affect blood pressure regulation
- Decreased kidney function in processing sodium and fluids
New Guidelines for Older Adults
Historically, higher blood pressure was considered “normal” for older adults. The outdated guideline allowed readings up to 150/80 mmHg for those over 65. However, modern research shows this approach may have underestimated cardiovascular risks.
The current American Heart Association and American College of Cardiology guidelines recommend the same targets for all adults regardless of age: below 120/80 mmHg is optimal, and treatment is recommended at 130/80 mmHg and above.
This shift recognizes that age-related blood pressure increases, while common, aren’t necessarily healthy. Proper management of blood pressure throughout life can significantly reduce health risks as we age.
Monitoring Age-Related Changes
Understanding how blood pressure typically changes with age helps put your readings in context. Regular monitoring becomes increasingly important as you get older, as does personalized assessment that considers your complete health profile.
In the second part of our blog content introduction, we have prepared valuable articles in the field of healthy nutrition and weight loss for you. To access them, simply use the links below:
Blood Pressure Chart by Age and Gender
Men and women typically have different blood pressure patterns throughout life. Understanding these gender differences helps interpret your readings more accurately.
How Gender Affects Blood Pressure
On average, men have higher blood pressure than women until around age 60. After menopause, women’s blood pressure often rises, sometimes exceeding men’s in later years.
| Age Group | Average BP (Male) | Average BP (Female) |
|---|---|---|
| 18-39 years | 119/70 mmHg | 110/68 mmHg |
| 40-59 years | 124/77 mmHg | 122/74 mmHg |
| 60+ years | 133/69 mmHg | 139/68 mmHg |
Physiological Reasons for Gender Differences
Several factors contribute to these gender-based differences:
- Hormones: Estrogen in women helps protect blood vessels until menopause
- Body size: Men typically have larger body mass, which can influence blood pressure
- Vascular structure: Subtle differences in blood vessel anatomy
Female-Specific Blood Pressure Patterns
Women experience unique blood pressure patterns during:
- Menstrual cycle: Slight fluctuations with hormonal changes
- Pregnancy: Initially decreases, then typically returns to pre-pregnancy levels
- Menopause: Often marks a significant rise as protective estrogen decreases
Despite these differences, the target for healthy blood pressure remains the same for both genders: below 120/80 mmHg. Given these gender-specific patterns, personalized assessment is valuable for accurate interpretation of your blood pressure readings.
Special Considerations for Blood Pressure Readings
Blood pressure isn’t constant—it naturally fluctuates throughout the day and can be influenced by many factors. Understanding these variables helps ensure more accurate readings.
Factors Affecting Blood Pressure Measurement
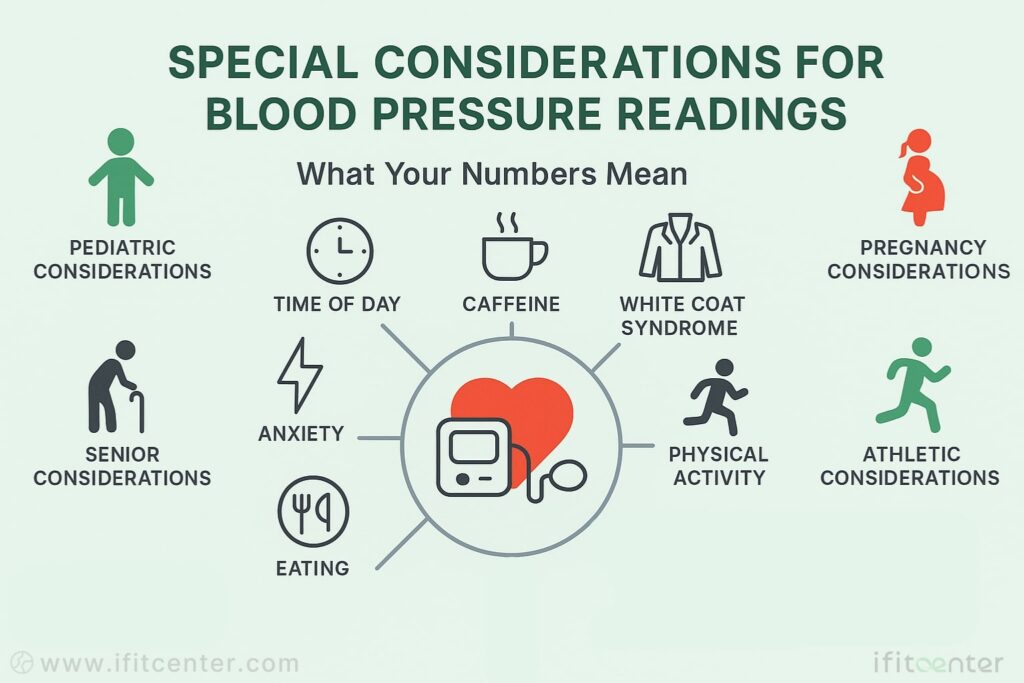
Several common situations can temporarily affect your blood pressure readings:
- White coat hypertension: Blood pressure rises due to anxiety in medical settings
- Masked hypertension: Normal readings at the doctor’s office but elevated at home
- Time of day: Blood pressure is typically lowest while sleeping and rises in the morning
- Recent activities: Exercise, caffeine, alcohol, and smoking can temporarily raise readings
- Stress and anxiety: Emotional state significantly impacts blood pressure
- Full bladder: Can raise systolic pressure by 10-15 points
- Talking during measurement: Can increase readings by 10-15 points
- Incorrect cuff position: The cuff should be on bare skin, not over clothing
Tips for Accurate Home Measurements
- Rest quietly for 5 minutes before measuring
- Sit with back supported and feet flat on floor
- Position arm at heart level with palm up
- Don’t smoke, exercise, or consume caffeine 30 minutes before
- Take 2-3 readings one minute apart and record the average
- Measure at the same time each day for consistency
For the most reliable assessment of your blood pressure, multiple readings over time provide better information than a single measurement. This helps distinguish between temporary fluctuations and your true baseline blood pressure.
“When examining blood pressure patterns, I find that many patients focus solely on high readings while overlooking consistently low measurements. While hypertension gets more attention, hypotension—blood pressure below 90/60 mmHg—can cause concerning symptoms like dizziness and fainting, particularly in older adults. Both extremes deserve attention. I recommend patients record not just the numbers but also note any symptoms experienced at the time of measurement. This context is invaluable for proper interpretation of your blood pressure chart.”
Dr. Babak Jamalian, Family Physician
Blood Pressure Chart Special Considerations
Blood pressure readings require special interpretation for specific groups:
- Children and adolescents: Pediatric blood pressure charts use percentiles based on age, height, and gender. Normal ranges for children vary from newborns (60-90/20-60 mmHg) to adolescents (112-128/66-80 mmHg).
- Pregnant women: Normal blood pressure during pregnancy chart values differ, with readings typically lower in the first and second trimesters. Blood pressure above 140/90 mmHg may indicate pregnancy-induced hypertension.
- Elderly patients: Senior blood pressure charts now recommend the same targets as younger adults, though readings should be checked in both sitting and standing positions to detect orthostatic changes.
- Athletes: Often show lower resting blood pressure due to cardiovascular conditioning; readings should be interpreted with their fitness level in mind.
Home Blood Pressure Monitoring Tips
For accurate home blood pressure measurement:
- Use an upper arm cuff (not wrist) device that’s been validated
- Sit with back supported and feet flat on floor for 5 minutes before measuring
- Position arm at heart level on a flat surface
- Take readings before medications, caffeine, or exercise
- Record multiple readings (2-3) one minute apart
- Measure at the same time daily for your blood pressure tracking chart
Multiple readings provide a more accurate assessment than a single measurement. According to the American Heart Association, “blood pressure fluctuates a lot, so a patient shouldn’t worry about one high reading.” Professional evaluation helps determine if your blood pressure readings indicate a need for treatment.
Blood Pressure Chart: Key Takeaways
Understanding your blood pressure chart readings is essential for cardiovascular health management. Remember these important points:
- Normal blood pressure is below 120/80 mmHg for all adults regardless of age
- Blood pressure varies by age and gender, but healthy targets remain the same
- Regular monitoring helps track patterns and changes over time
- Seek immediate medical attention for readings above 180/120 mmHg with symptoms
- Both lifestyle factors and genetics influence your blood pressure levels
By understanding how to interpret your readings using appropriate blood pressure charts by age and gender, you gain valuable insights that can help maintain healthy blood pressure throughout your life.
To access other content on the IFitCenter’s blog, you can use the following links:
References
- American Heart Association
- Blood pressure UK
- Mayo Clinic
- Harvard Health Publishing


